A trade made $200. The account showed $34.70.
Three numbers decide whether a winning trade pays you or pays the exchange. We read them from the exchange's own API and show the subtraction most people never do.
You open a long at 10×. The price moves 0.2% your way. You close it.
Your account is $34.70 richer. You expected $200.
Nothing broke. The difference is the fee schedule, and it is decided before you ever see the market. Read where the $165.30 went →
Futures cost calculator
Rates: maker -0.0100% · taker 0.0750% · captured 2026-10-26T03:50ZNegative numbers mean you were paid rather than charged. Funding uses the current rate held constant; on a perpetual it changes every settlement and can also go in your favour. This is an estimate from one captured rate set, not a quote.
Rates we captured on 2026-10-26T03:50Z
How we capture rates| Item | Value | What it means in practice |
|---|---|---|
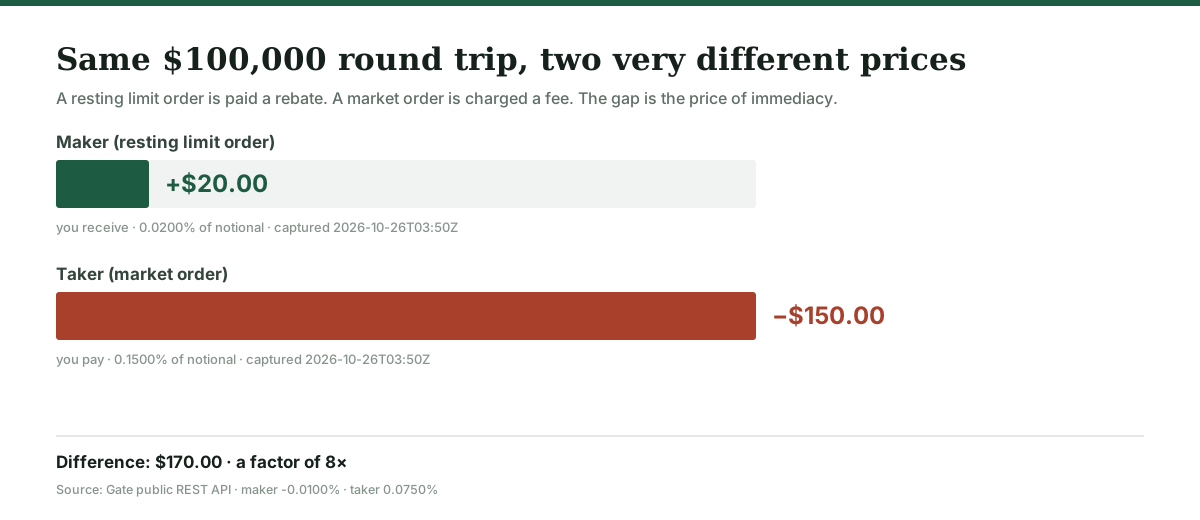
| Perpetual maker fee | -0.0100% | You add liquidity and are paid a rebate; a $100,000 round trip earns $20 |
| Perpetual taker fee | 0.0750% | You remove liquidity; the same round trip costs $150 |
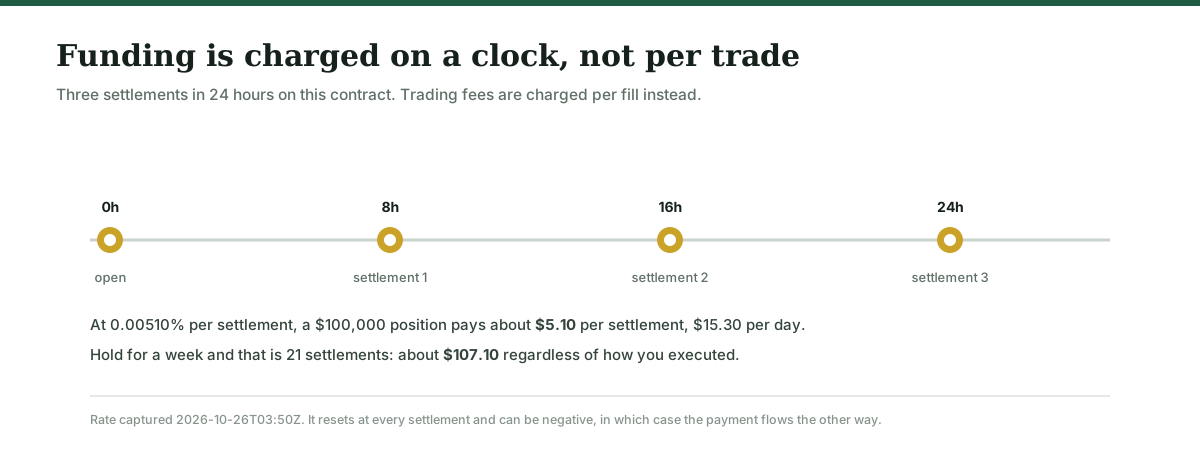
| Funding rate | 0.00510% | Charged every 8 hours on the contract's notional while the position is open |
| Spot trading fee | 0.20% | Single published rate; the API does not split maker and taker for spot |
| Maximum leverage | 200× | Raises both position size and the dollar cost of every fill |
| Ratio, taker to maker | 8× | The single largest lever on trading cost that most people never check |
A $200 trade, three different mornings
Full walkthrough10× leverage on $10,000 of your own money gives a $100,000 position. The price moves 0.2% in your favour, which is $200 of gross profit. The rows below show what each execution method leaves you.
| Execution | Trading fee | Funding | Net profit | Fee as % of gain |
|---|---|---|---|---|
| Limit in, limit out (maker) | +$20.00 | $15.30 | $204.70 | 0% |
| Market in, market out (taker) | −$150.00 | $15.30 | $34.70 | 83% |
| Same trade, ten market round trips | −$1,500.00 | $15.30 | +$484.70 | 76% |
The middle row is the one worth sitting with: a trade that made $200 kept $34.70. The bottom row is the same trade turned into a loss by order frequency alone, not by being wrong about the market.
Common questions
Start from the beginningCosts
Account
About the numbers
About this site
Most pages about crypto exchange fees copy a table from another page and stop there. The numbers are frequently a year or more old, and rarely say when they were checked.
This site takes a narrower approach. It reads rates from the exchange's own machine-readable API where one exists, records the exact moment, and shows the arithmetic rather than a verdict. When a number cannot be verified from a primary source, it is marked as unverified instead of being filled in.
There is no ranking, no "best exchange" list, and no profit promise. The pages are written for people who are about to place an order and want to know what it will cost.
Two things to keep in mind
Fees are one part of cost. Spread, slippage, liquidation and funding can matter far more than the published rate. And every rate on this site is a point-in-time capture — confirm it in your own account before sizing a position.