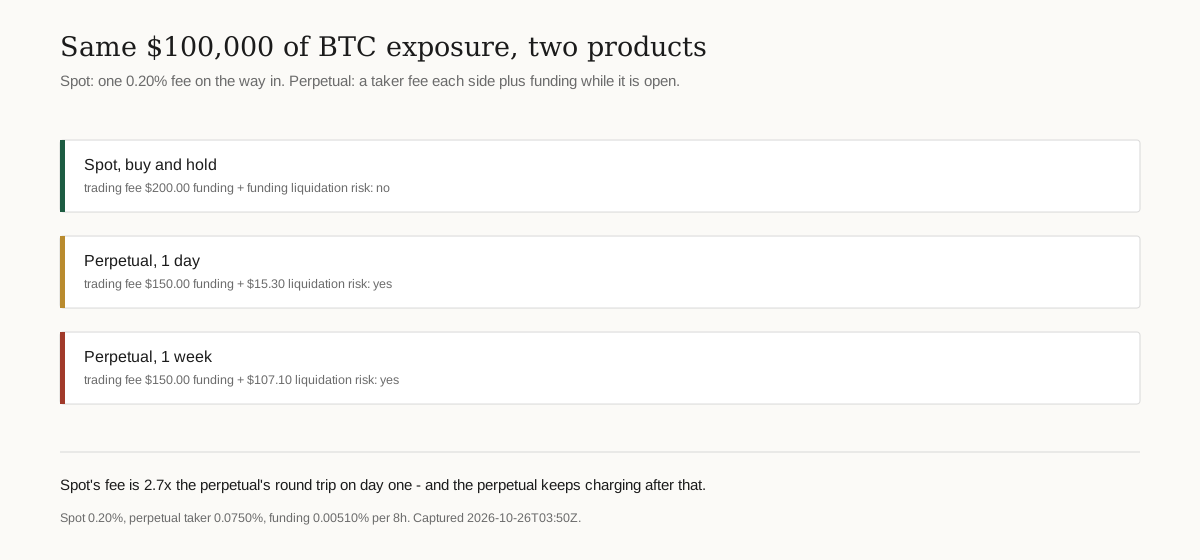
A spot buyer and a perpetual trader both take $100,000.00 of bitcoin exposure.
The spot buyer pays $400.00 in fees. The perpetual trader pays $20.00.
The perpetual trader is $380.00 better off on day one.
Then day one ends, and funding arrives every eight hours after that.
Spot and perpetual get compared as if they were the same exposure at different prices. They are not. Spot is a purchase with a one-time cost. A perpetual is a rental with a small entry fee and a meter running. Which one is cheaper is entirely a question of how long you intend to hold.
The switch happens faster than people expect
Both sides of the perpetual carry the maker rate here, so the round trip is $20.00 on $100,000.00. Spot costs $400.00 to buy and resell, at the captured spot rate of 20.00% a side.
That is the break-even, and it is not a long time. A swing trade that turns into a hold crosses it without anyone noticing, because funding is charged in a line item nobody reads and the fee saving was a visible improvement on the order preview.
| Exposure held as | Trading fees | Funding | Liquidation risk | Total on $100,000 |
|---|---|---|---|---|
| Spot, bought and sold | $400.00 | none | no | $400.00 |
| Perpetual, 1 day, maker | $20.00 | $15.30 | yes | $35.30 |
| Perpetual, 1 week, maker | $20.00 | $107.10 | yes | $127.10 |
| Perpetual, 1 month, maker | $20.00 | $459.00 | yes | $479.00 |
| Perpetual, 1 day, taker | $150.00 | $15.30 | yes | $165.30 |
Read the first and third rows together. Holding the same exposure for one week as a perpetual costs $127.10 against $400.00 for spot — the product that looked $380.00 more expensive on day one is −$272.90 cheaper by day seven.
The counter-intuitive part: the spot fee is the honest one
A 0.20% spot fee looks worse than a 0.01% maker rebate, and that comparison is how perpetual contracts get sold as the cheap way to hold. But it is not the same kind of number. The spot fee is the whole cost of the position. The maker rate is the entry cost of a position that charges rent.
Which makes the perpetual the better tool for exactly one use case: a position you intend to close soon, where the leverage lets you post less capital. For everything else — holding a view over weeks, owning the asset, avoiding a liquidation price — the product with the higher headline fee is the cheaper one.
The cost that is not a cost until it is
There is a third column in that table that does not have a number: liquidation risk. A spot position can fall 90% and still be yours. A perpetual at 10× with $10,000.00 of margin is closed out at roughly 9.7% against you, and the loss is total regardless of what the price does next.
That is not a fee and it does not belong in a cost comparison, which is precisely why it gets left out of one. It is also the only line in the table that can exceed $100,000.00.
Two minutes: pick by holding period, not by fee
- Write down how long you intend to hold. Not a range — a number of days.
- Multiply your notional by the funding rate by 3 by that number of days. That is the rental cost of the perpetual.
- Compare it to the difference between the spot fee and the perpetual fee on the same notional. Here that difference is $380.00 on $100,000.00.
- If the rental is bigger, the perpetual is not the cheap option — it is the leveraged option, and you are paying for the leverage.
Nothing about that calculation requires knowing where the price goes. It only requires knowing how long you plan to be in, which is the decision traders make last and should make first.
Where these numbers come from
Measured: Gate contract endpoint — perpetual fees, funding and maintenance rate
Price reference: CoinGecko: bitcoin — the index a perpetual's funding is computed against
Background: Investor.gov: leverage — why a leveraged position can be closed without your consent
Background: Investor.gov glossary: liquidity — why a spot position has no liquidation price
Spot and perpetual rates above were captured at 2026-10-26T03:50Z. Both change; the comparison method does not.
Open a Gate account Referral link — we may earn a commission at no extra cost to you. Gate's services are not available in every jurisdiction; check the User Agreement.Sources
- Gate public REST API: spot fee 0.2 per side for BTC_USDT, perpetual maker_fee_rate -0.0001, taker_fee_rate 0.00075, funding_rate 5.1e-05 every 8 hours, maintenance_rate 0.003. Captured 2026-10-26T03:50Z.
- Break-even holding period computed as (spot round trip − perpetual maker round trip) ÷ weekly funding, rounded to one decimal place.
- Liquidation distance computed as (1 ÷ leverage) − maintenance rate, isolated margin, fees excluded, and stated as approximate in the text.